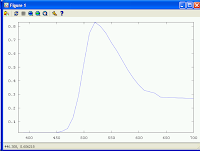
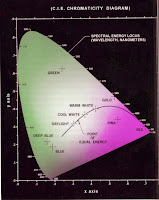
1. With data from the Chromaticity diagram on page 400 I used Excel to create the tables of values which I then put into Octave.
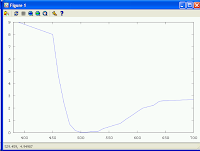
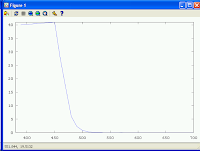
The values were entered as lists: w = wavelength, x = red, y = green, and z = 1-x-y = blue. For the other two graphs, I used a = x/y and b = z/y
Wavelength vs. y

Wavelength vs x/y
 Wavelength vs z/y
6. a)

b) In Photoshop: (with thanks to my son for his expert advice)
- Open the "channels" toolbox
- click on Red so it's the only one selected (the picture will go greyscale because it's just the red channel)
- select all, copy, click RGB so it's in colour again
- go to the layers palette, make a new layer, paste
- click the eye to hide that layer, click the background layer
- go back to channels and do the same thing for the blue channel
- when you're done that, you should have the original background layer,
and two new layers on top, each one greyscale (and hidden)
all you need to do now is click on Layer 1, select all, copy, click the background layer, then go to channels and click on blue, then paste (so what was in red is now in blue)
then do the same for layer 2, pasted in to the red channel
Then click the RGB channel, go back to the layers palette, and delete the extra grey layers.
No comments:
Post a Comment